
Dash 8 q400 market value 2026
Dash 8 Q400 Market Value Report 2026: Comprehensive Analysis of the Iconic High-Speed Turboprop
Complete 2026 market analysis of the Dash 8 Q400, including fleet status, technical specs, lease rates, PW150A engine market, Q400 vs ATR72 comparison, freighter conversions, and expert outlook for buyers, lessors, and investors.
Last Updated: June 2026
Executive Summary: Dash 8 Q400 Market at a Glance (2026)
| Fleet Active | Approximately 367 |
| Total Delivered | 575–620+ |
| Production Status | Paused (restart under evaluation) |
| Market Value Range (Passenger) | $5.3M – $19.5M |
| Market Value (Freighter Premium) | +$0.5M – $2.0M |
| Lease Rate (Monthly Dry) | $55,000 – $160,000 |
| Engine | Pratt & Whitney Canada PW150A |
| Seating Capacity | 74–90 passengers |
| Cruise Speed | Up to 360 knots |
| Range | 1,300 – 1,700+ nm |
| Dispatch Reliability | >99.5% |
Values are indicative. Professional appraisal recommended for specific aircraft.
The Bombardier Dash 8 Q400 (now under De Havilland Canada) remains one of the most capable large turboprops in the global aviation market. As of mid-2026, with production paused and the industry focusing on efficiency and regional connectivity, understanding its market value, operational economics, and future potential is essential for airlines, lessors, investors, and operators.
This in-depth Dash 8 Q400 Market Value Report 2026 provides a complete overview, drawing from recent industry data, appraisals, and market transactions. Whether you're evaluating acquisition, leasing, or fleet planning, this guide covers history, specifications, values, costs, and outlook.
Need a personalised Q400 valuation or sourcing support? Contact Safe Fly Aviation for expert assistance.
History and Evolution of the Dash 8 Q400
The Dash 8 family originated with de Havilland Canada in the 1980s. The Q400 variant, introduced in the late 1990s and entering service around 2000, was designed as a high-speed turboprop to compete with regional jets on shorter routes while delivering superior fuel efficiency.
Bombardier acquired de Havilland and developed the NextGen (NG) version with upgrades including larger overhead bins, improved cabin, and higher design weights. Production exceeded 600 units before pausing in 2021 after the Downsview facility closure. De Havilland Canada, under Longview Aviation, has explored restarting production in Calgary, with decisions anticipated around 2025-2026.
The Q400's PW150A engines provide excellent hot-and-high and short-field performance, making it popular in challenging environments like mountainous regions, Africa, and parts of Asia and North America.
Technical Specifications and Performance Highlights
The Dash 8 Q400 stands out among turboprops with a unique blend of speed, range, and efficiency:
| Specification | Detail |
|---|---|
| Seating | 74–90 passengers (standard 78–82; high-density up to 90) |
| Engines | 2 × Pratt & Whitney Canada PW150A turboprops |
| Cruise Speed | Up to 360 knots (significantly faster than ATR72's ~270–300 knots) |
| Range | Approximately 1,300–1,700+ nm (depending on configuration and payload) |
| Takeoff/Landing | Excellent short-field performance |
| Cabin | Pressurized, quiet (Q for "Quiet"), modern NextGen interiors |
| Dimensions | Length ~107.75 ft, wingspan suitable for regional airports |
| Payload (Freighter) | 10+ tonnes |
Performance Edge
Superior climb rates and range make it ideal for hot/high operations where jets struggle. Dispatch reliability exceeds 99.5%, with millions of flight hours accumulated.
Operational Advantages and Use Cases
The Q400 excels in regional passenger transport, cargo, and hybrid operations:
- Passenger Services: Dense networks in North America (e.g., Air Canada Express), Africa, and Asia.
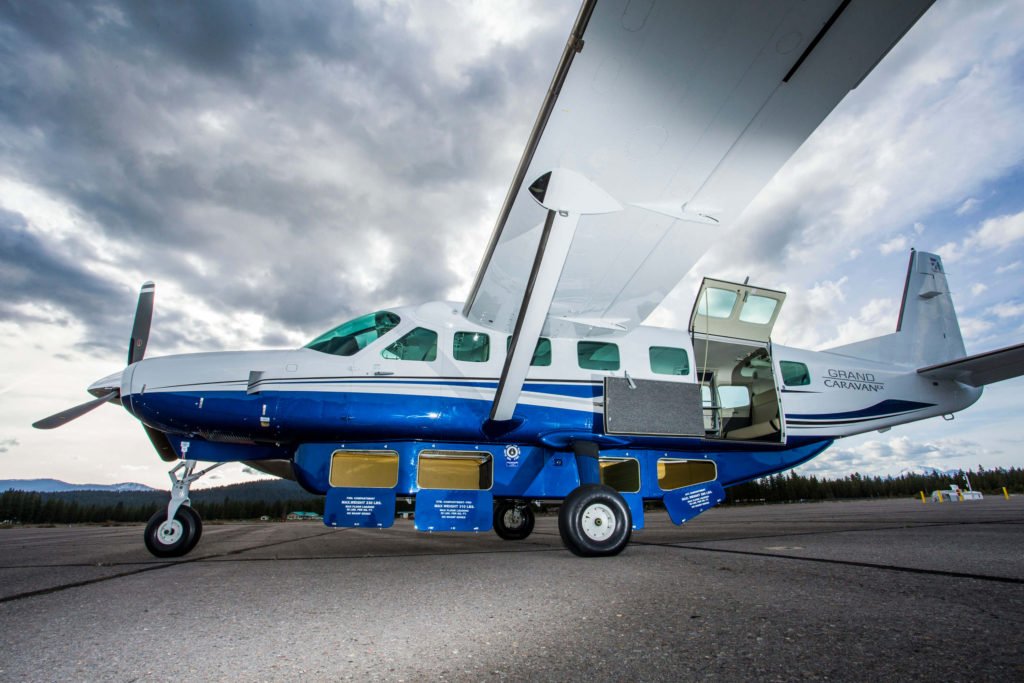
- Cargo / Freighter Conversions: Quick Change (QC), Package Freighter (PF), and Large Cargo Door (LCD) variants offer 9–10+ tonnes payload. Conversions are gaining traction in Canada and Kenya.
- Versatility: Short runways, unpaved strips (in some configs), and challenging weather.
Operators value its lower seat-mile costs versus jets on thin routes and faster turnaround than slower turboprops.
Global Fleet Status in 2026
Approximately 367 Q400s remain active as of late 2025 data, with a total delivered fleet around 575–620+. The operator base spans 60+ airlines, though concentrated among top 10 carriers holding nearly half the fleet.
Major Q400 Operators (Representative)
| Operator | Approx. Fleet | Region |
|---|---|---|
| Air Canada Express | 40+ | North America |
| Ethiopian Airlines | 25+ | Africa |
| SpiceJet | 30+ | India / Asia |
| Widerøe | 30+ | Europe |
| PAL Airlines | 25+ | North America |
| Luxair | 10+ | Europe |
| Horizon Air (historical) | Retired | North America |
Fleet figures are approximate and based on industry sources as of mid-2026.
Key regions: Strong in North America and Africa; declining in Europe; growing potential in Asia and emerging markets. Storage levels have stabilized post-COVID, with many aircraft returning to service or converting.
Dash 8 Q400 vs ATR72-600: Head-to-Head Comparison
The Q400 and ATR72 are the two dominant large turboprops. This comparison helps operators and investors evaluate which platform best suits their network and business model.
| Metric | Dash 8 Q400 | ATR72-600 |
|---|---|---|
| Seating | 78–90 | 72–78 |
| Cruise Speed | 360 knots | 275 knots |
| Range | ~1,500 nm | ~900 nm |
| Fuel Burn (per hour) | 1,100–1,300 kg | ~700–800 kg |
| Acquisition Cost (used) | $5.3M – $20M+ | $4M – $12M |
| Maintenance Cost | Higher | Lower |
| Short-Field Performance | Excellent | Very Good |
| Hot & High Performance | Superior | Good |
| Freighter Conversion | Available (LCD, PF, QC) | Available (P2F) |
Which Aircraft Is Right for You?
- Choose Q400 if: You need speed, longer range, higher capacity, or hot-and-high performance. It excels on medium sectors where block time matters.
- Choose ATR72 if: Your priority is lowest fuel burn and operating costs on short sectors, and you value a larger secondary market and lower acquisition cost.
Both aircraft have strong support networks. The Q400's speed advantage can reduce crew costs and improve aircraft utilization on longer regional routes.
Q400 Fleet Age Distribution
Understanding the age profile of the active Q400 fleet helps assess maintenance demand, parts availability, and future retirement patterns.
| Vintage | Approx. Fleet Share |
|---|---|
| 2000–2005 | ~25% |
| 2006–2010 | ~35% |
| 2011–2015 | ~25% |
| 2016–2021 | ~15% |
Age distribution estimates based on industry data. Actual percentages may vary.
The concentration of aircraft in the 2006–2010 vintage bracket suggests a significant wave of maintenance events and potential replacement opportunities in the coming years.
Dash 8 Q400 Market Value Analysis 2026
Market values have rebounded from pandemic lows but vary widely by age, condition, and configuration.
Representative Market Valuation Examples
| Year | Hours | Condition | Representative Value (USD) |
|---|---|---|---|
| 2012 | 28,000 | Passenger | $7.8M |
| 2015 | 22,000 | Passenger (NG) | $11.5M |
| 2018 | 16,000 | Passenger (NG) | $14.0M |
| 2021 | 8,000 | Passenger (NG) | $19.0M |
| 2010 | 30,000 | QC Freighter | $6.5M |
| 2014 | 24,000 | LCD Freighter | $8.5M |
Values are representative examples based on market data. Actual prices depend on maintenance status, engine condition, and documentation.
Base Value Ranges
- Newest Examples (2021 build): ~$19.5 million
- Mid-Life (2004–2012, half-life): $5.3 – $7.6 million
- Above Half-Life / Newer (e.g., good 2008): Exceeds $8 million
- Average Pre-Owned: ~$8.5 million
- Newer Units (2011–2012 asking): $17 – $20 million
Freighter Variant Premiums
- Package Freighter (PF): Adds $0.5–0.7M premium
- Large Cargo Door (LCD): Often $8M+ due to conversion costs (>$2M)
- Quick Change (QC): Similar to passenger
Factors Influencing Value
- Maintenance reserves and remaining life on engines/airframe
- Avionics, interior configuration, and modifications
- Market liquidity: fewer transactions than ATR72, leading to variability
- Economic conditions, fuel prices, and regional demand
Professional appraisals (e.g., from IBA, Aircraft Bluebook, or Conklin & de Decker) are recommended for specific aircraft.
Lease Rates and Financing Options
Lease rates have recovered strongly:
| Vintage / Type | Monthly Dry Lease (USD) |
|---|---|
| Recent 2021 examples | Up to $160,000 |
| 2010 vintage passenger | ~$70,000 |
| Mid-life passenger (2004–2012) | $55,000 – $74,000 |
| PF Freighter | $62,000 – $80,000 |
| LCD Freighter | $70,000 – $90,000 |
Lessors like NAC, Falko, and Aergo hold significant portfolios. Financing benefits from established support networks, though De Havilland's long-term OEM commitment is monitored.
For buyers, loans and operating leases are common. Residual value projections remain positive for well-maintained units given the aircraft's robustness.
Pratt & Whitney Canada PW150A Engine Market
The PW150A is the exclusive powerplant for the Dash 8 Q400. Its availability, value, and maintenance costs are critical to Q400 ownership economics.
PW150A Engine Market Values
| Condition | Estimated Value (USD) |
|---|---|
| Fresh Overhaul | $2,000,000 – $3,000,000 |
| Serviceable Used | $1,000,000 – $2,000,000 |
| Core Engine | $300,000 – $800,000 |
Key Engine Value Drivers
- Time Since Overhaul: Engines closer to overhaul command lower prices.
- LLP Status: Life-Limited Parts (LLPs) significantly impact residual value.
- Green Time: Remaining hours/cycles before overhaul represent substantial value.
- Damage History: FOD, bird strikes, or hard landings reduce value.
- Documentation Completeness: Full logbooks and traceability are essential.
Overhaul and Maintenance Costs
- Full Overhaul: Typically $1.5 – $2.5 million depending on LLP replacements.
- Turnaround Time: 8–16 weeks depending on MRO workload.
- Exchange Programs: Available through specialists like Safe Fly Aviation to minimize downtime.
Need PW150A engine sourcing, valuation, or exchange support? View our PW150A Engine Market Report or contact Safe Fly Aviation.
Q400 Passenger-to-Freighter Conversion Market
The Q400 has become a popular platform for freighter conversions, driven by strong e-commerce demand, express cargo growth, and the aircraft's inherent payload and range capabilities.
Conversion Types
- Quick Change (QC): Flexible passenger/freight configuration with removable seats and cargo pallets. Ideal for mixed-use operations.
- Package Freighter (PF): Dedicated freighter with reinforced floor, 9G barrier, and cargo loading system. Typical payload 9+ tonnes.
- Large Cargo Door (LCD): Premium freighter conversion with a large main-deck cargo door (approx. 1.8m x 1.2m) enabling containerised freight. Payload up to 10.5 tonnes.
Conversion Costs and Lead Times
- LCD Conversion: Typically over US$2 million, with 4–6 months downtime.
- PF Conversion: Slightly lower cost, 3–5 months.
- QC Conversion: Lower capital cost, retains passenger flexibility.
Market Demand and Value Premium
Strong cargo demand, particularly in Africa, Southeast Asia, and North America, has driven interest in Q400 freighters. LCD and PF variants command value premiums of US$0.5–2 million over comparable passenger aircraft. The freighter conversion market is expected to remain active through 2026–2028 as operators seek cost-effective cargo solutions.
Interested in a Q400 freighter conversion or acquisition? Contact Safe Fly Aviation for specialist advice.
Buyer's Checklist: What to Verify Before Purchasing a Q400
Before committing to a Q400 acquisition, operators and investors should conduct a thorough technical and commercial review. This checklist covers critical areas:
Safe Fly Aviation can assist with pre-purchase inspections, records reviews, and valuation services to ensure a sound investment.
Safe Fly Aviation Market Intelligence – Q2 2026
During the first half of 2026, Safe Fly Aviation observed increased inquiry activity from Africa, Southeast Asia, and cargo operators seeking Q400 passenger-to-freighter conversion opportunities. Demand for well-maintained mid-life passenger units with strong engine green time remains robust, with multiple buyers competing for high-quality inventory.
Engine-related inquiries have also risen, driven by operators planning ahead for PW150A overhaul intervals and seeking exchange or green-time engines to avoid AOG situations. Lessor portfolio rebalancing and fleet modernisation programs are generating Q400 sales opportunities, particularly in Europe and North America.
For current market intelligence and sourcing support, contact Safe Fly Aviation.
Maintenance, Operating Costs, and Economics
Acquisition Cost
New ~$27M (list price historically); pre-owned averages $8.5M–$20M.
Operating Costs
- Variable and fixed costs vary by utilization. Engines are powerful but have higher maintenance than smaller turboprops.
- Fuel efficiency strong on short sectors; speed advantage reduces crew and ownership costs per trip.
- Detailed reports from Conklin & de Decker or Aircraft Cost Calculator provide tailored data.
The Q400 offers competitive CASM (cost per available seat mile) versus regional jets on many routes. High dispatch reliability minimizes downtime.
Key Operators and Success Stories
Major operators include Air Canada Express, Ethiopian Airlines, SpiceJet, Widerøe, and PAL Airlines. Its performance in challenging environments has built a loyal base. Freighter operators like Wasaya, Air Inuit, and 748 Air Services demonstrate cargo versatility.
Challenges and Considerations
- Production Status: Paused; potential restart uncertain but supported by aftermarket demand.
- Competition: ATR72 dominates in volume and some cost metrics, but Q400 wins on speed/range.
- Sustainability: Interest in hydrogen/hybrid retrofits (e.g., ZeroAvia projects).
- Parts and Support: Strong network, but monitor De Havilland/P&WC commitments.
Future Outlook for 2026 and Beyond
Regional air travel demand grows, favoring turboprops for efficiency. Freighter conversions provide new life for older airframes. Potential new production or upgrades could boost values. Emerging tech like hybrid propulsion may extend the type's relevance.
Overall market sentiment is cautiously optimistic, with values stabilizing and demand for capable regional assets persisting.
Conclusion: Is the Dash 8 Q400 a Smart Investment in 2026?
The Q400 delivers unmatched versatility, performance, and economics for regional operations. Market values reflect a rebounding sector, with opportunities in passenger, cargo, and mixed fleets. For accurate valuation of a specific aircraft, consult certified appraisers and review current listings and maintenance records.
At Safe Fly Aviation, we support operators with insights, sourcing, and solutions for Dash 8 Q400 and similar assets. Contact us for personalized fleet advice or market updates.
Frequently Asked Questions About the Dash 8 Q400
Values range from approximately US$5.3 million for older mid-life passenger examples to over US$19 million for newest 2021 builds. Freighter variants command premiums of US$0.5–2 million depending on conversion type.
Monthly dry lease rates range from US$55,000–$74,000 for mid-life passenger units, up to US$160,000 for recent 2021 examples. Freighter variants typically lease for US$62,000–$90,000 per month.
The Q400 burns approximately 1,100–1,300 kg of fuel per hour depending on stage length and payload. It offers significant fuel savings over regional jets on short to medium sectors.
Production has been paused since 2021. De Havilland Canada is evaluating a potential restart in Calgary, with decisions expected around 2025-2026.
A full overhaul of the PW150A typically costs between US$1.5–2.5 million, depending on the scope of work and LLP (Life-Limited Part) replacement requirements.
Air Canada Express, Ethiopian Airlines, SpiceJet, Widerøe, and PAL Airlines are among the largest operators. The fleet is concentrated in North America, Africa, and Asia-Pacific.
Large Cargo Door (LCD) conversions typically cost over US$2 million. Package Freighter (PF) conversions are slightly less. The conversion adds a premium of US$0.5–2 million to the aircraft's value.
The Q400 is faster (360 knots vs 275 knots) and has longer range (1,500 nm vs 900 nm) and higher capacity (78-90 seats vs 72-78 seats) than the ATR72, though it burns more fuel and has higher acquisition and maintenance costs.
The Q400 consistently achieves dispatch reliability rates exceeding 99.5%, with millions of flight hours accumulated across the global fleet.
Time Between Overhaul (TBO) for the PW150A is operator-dependent and influenced by utilization, operational environment, and maintenance program enrollment.
Looking to Acquire, Lease, or Value a Dash 8 Q400?
Safe Fly Aviation provides expert advisory, sourcing, and transaction support for Dash 8 Q400 aircraft, PW150A engines, and other regional turboprops. Our global network and market intelligence help you make informed decisions.
Speak with a Q400 Specialist